It all starts with Clarity.
Before you can improve performance, you need to know the truth about how your factory is really operating; across the factory, offices and supply chain; and how well this supports where your business is trying to go.
Why Clarity Matters
Most manufacturers want better performance; higher productivity, smoother flow, fewer issues, less firefighting.
But making the right improvements starts with knowing exactly what, where, and how to improve, and ensuring those improvements support your wider business goals.
Without that clarity, it’s easy to:
What ‘Clarity’ Gives You

A shared, honest picture of performance
No more guesswork. No more “it depends who you ask.” You get one aligned view of how your operation is performing today — and how well it supports your strategic intent.

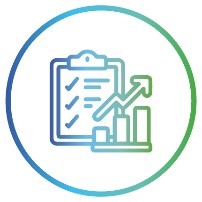
A clear roadmap for improvement
We show you exactly where to focus for the biggest and fastest impact.

Confidence in the journey ahead
With quantified potential benefits, clear stepping stones, and leadership needs alignment — you know what’s possible, why it matters, and how to get there.
What’s Included in Clarity
A) Operational Improvement Review (OIR)
What we do:
• Conduct workshops with your team
• Observe real work on the factory floor
• Review office-based processes (planning, scheduling, order management, supply chain)
• Analyse flow, bottlenecks, timing, handovers
• Identify gaps, causes, opportunities
• Quantify potential benefits (financial + operational)
• Create a prioritised improvement roadmap
• Assess how well operations support your business goals (subtle strategic alignment)
What you get:
• Key insights
• Quick wins
• Clear strategic recommendations
• Savings and productivity forecasts
• A realistic, actionable plan
- 5–15% additional annual profit generated through productivity gains
- £120K–£500K annualised savings released by streamlining operations
- 30–80% increase in yearly revenue capacity from improved flow and control
- £150K–£450K reduction in working capital through better planning and efficiency
Why it’s different:
B) Operational Benchmark Assessment Tool
One tool. Total clarity.
Why this tool exists:
Ask five people how the factory is performing — or what to improve first — and you’ll often get five different answers.
This tool gives one truth, so you can align and act together.
What it reveals:
- Strengths and weaknesses
- Hidden gaps
- Which inputs drive your outputs
- Where the biggest lift in performance will come from
- How well current performance aligns with your operational priorities
- How you compare across 8 key areas
C) Lean Awareness Training
2-Day Practical Course
Start dramatic factory improvement in just two days.
Delivered early in the Clarity stage to create shared understanding across your team:
- Why processes matter
- Why flow beats force
- What waste really looks like
- How Lean works in a real-world factory
- How to think “smarter, not harder”
What it reveals:
Because it shifts mindset early; so everyone enters the transformation with shared understanding and alignment around the purpose of change.
D) Champion Training (Senior Leaders)
Alignment at the top accelerates everything.
Your senior team learns:
- Their role in the change process
- How to sponsor improvement
- How to remove blockers
- How to communicate progress
- How to support team involvement
- How to create time to work on the business
- How to align operational activity with the business’s goals (subtle strategic layer)
Why it matters:
Why it matters:
Access Funding for Improvement
Digital Adoption for Manufacturing SMEs
(up to £20,000 matched funding)
- Matched funding up to £20,000 for digital technology and automation projects
- Lean Manufacturing Workshops and leadership programmes
- Support implementing AI, robotics and data analysis
- SMEs with less than 25 employees and under £36M turnover
- 50% co-investment. You fund half, the programme matches it.
- Includes ongoing coaching and supervision from our industry-experienced consultants
What Clarity Looks Like
Typical findings we uncover:
Planning that drives WIP and chaos
Flow that constantly stops and starts
Leadership routines missing or inconsistent
Office processes creating delays
Poor handovers between departments
Misaligned expectations
Low visibility of performance
Inconsistent quality feedback
This is why Clarity is essential, it gives everyone the same understanding of what’s happening and what needs to change.
What You Walk Away With
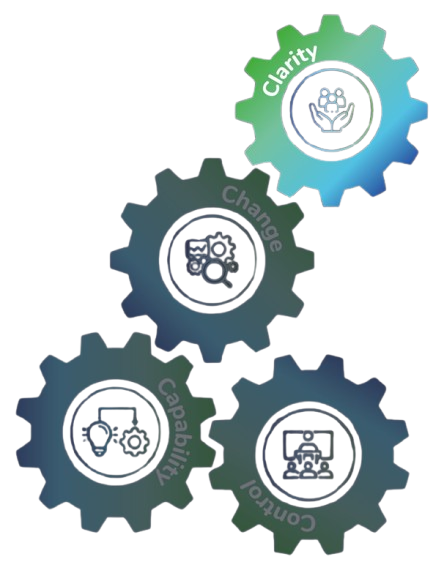
One truth about your whole operation
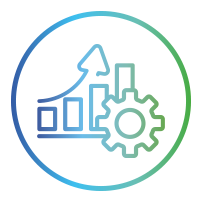
A prioritised improvement roadmap
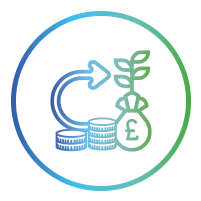
Quantified benefits
Quick wins identified
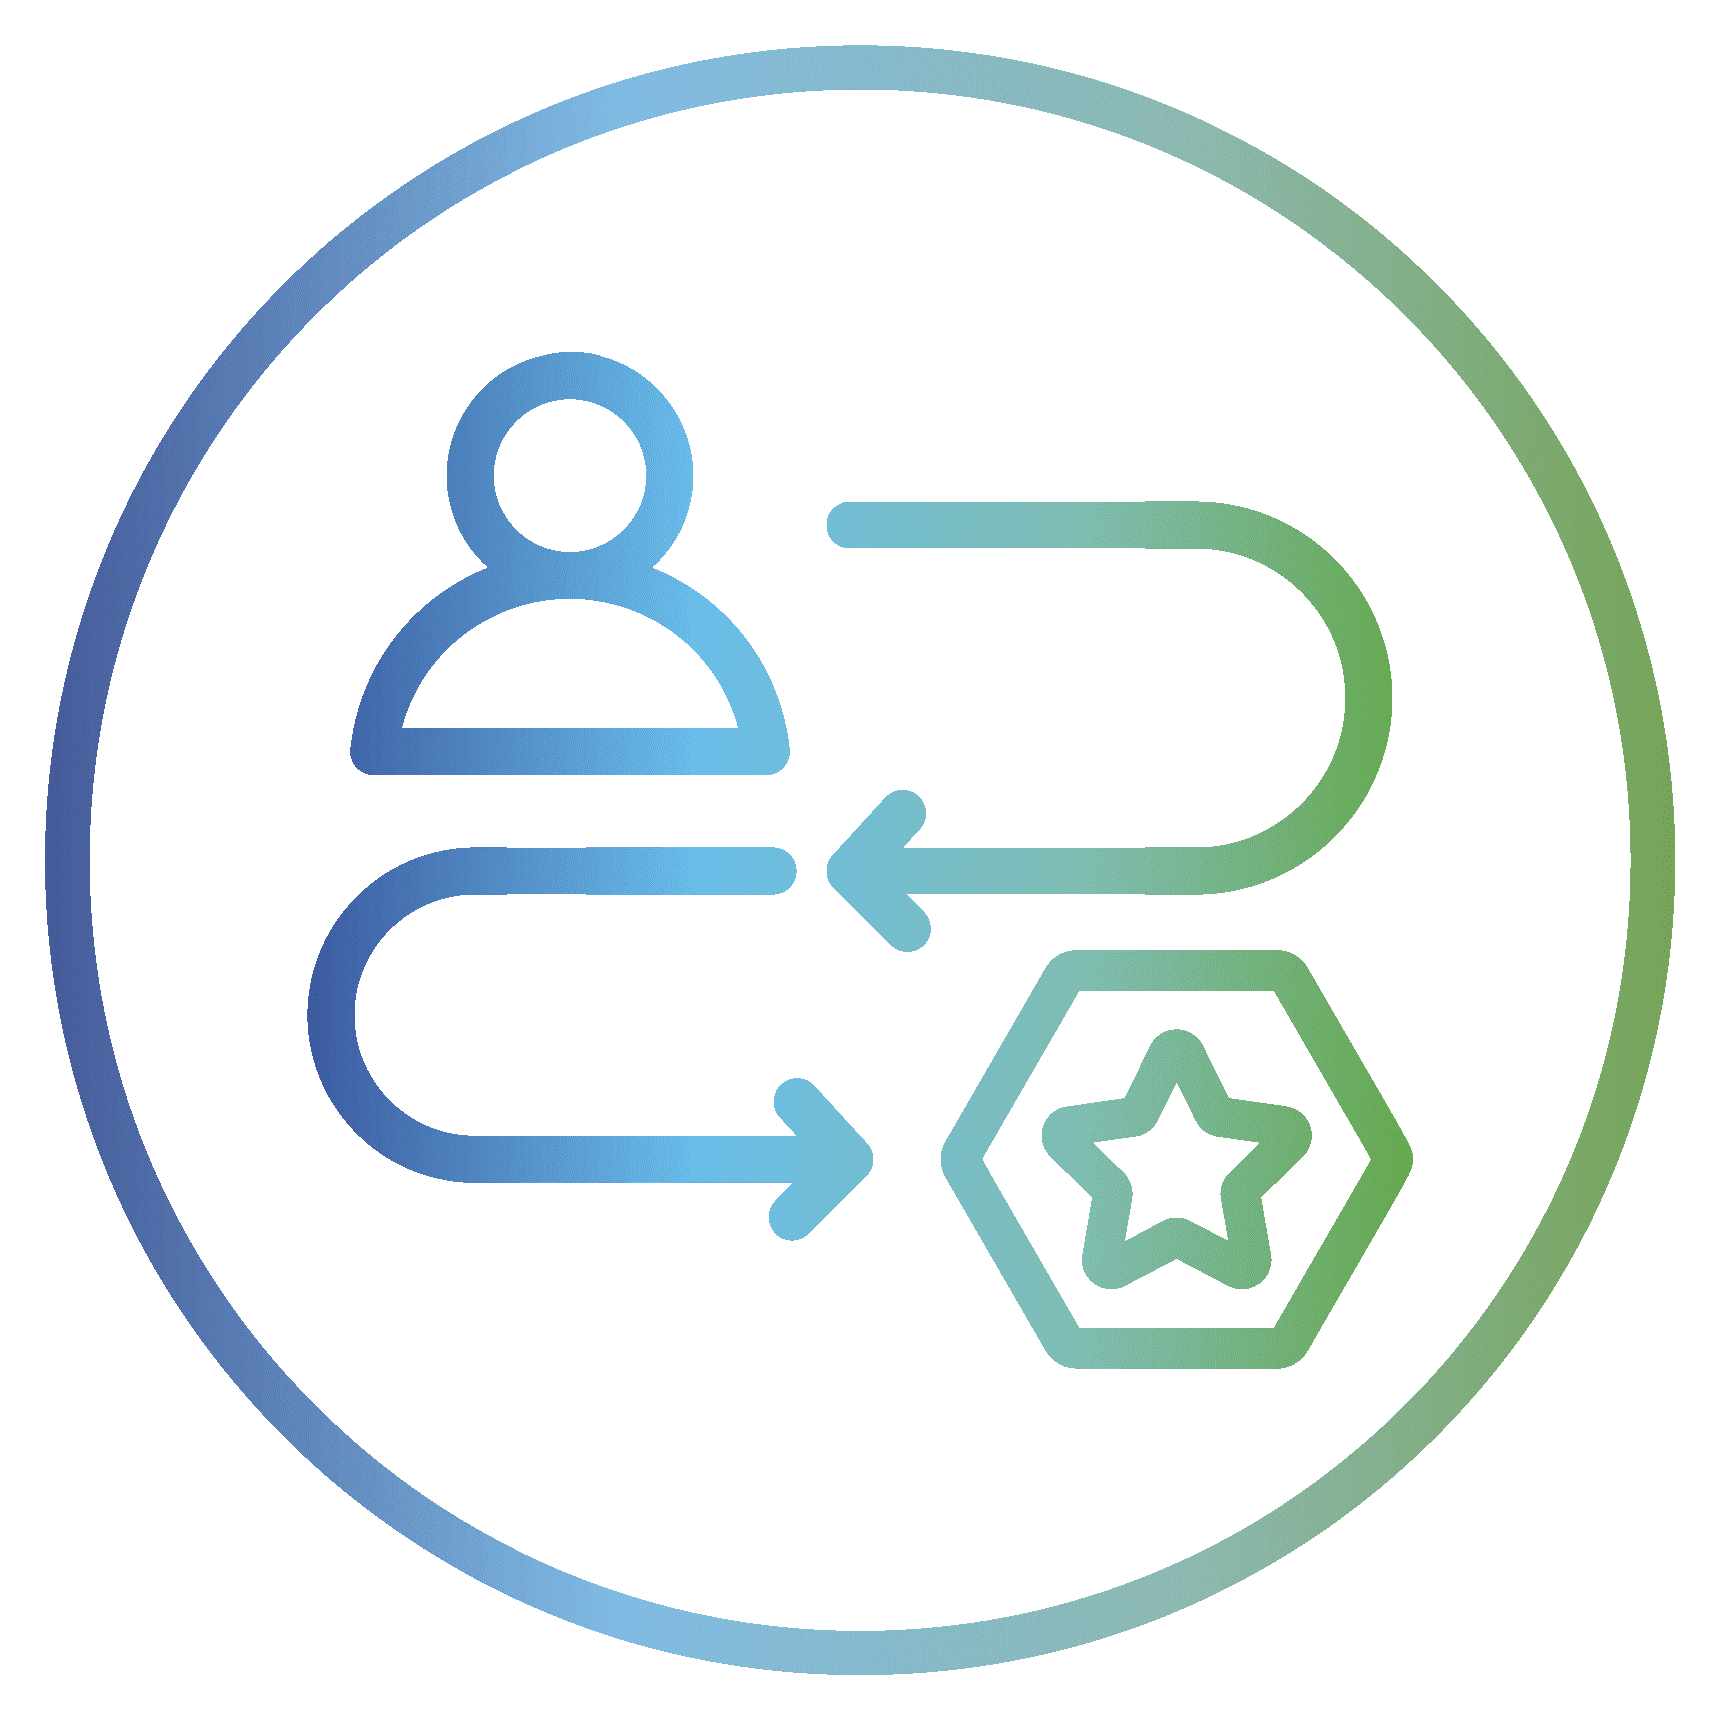
Team alignment
Confidence in what happens next
Description
Benchmark tool
assessment*2
Interactive
workshops
Area observations
Deep-dive evaluations
Data analysis
Feedback report
Entry
£8,000*1
Description
Lite-touch assessment to identify key inefficiencies and provide generic improvement recommendations.
Benchmark tool assessment*2
- Outputs
- Inputs
Interactive workshops
2x workshops
- Strategy
- Current State Review
Area observations
- ½-day factory observations
Deep-dive evaluations
- -
Data analysis
- -
Feedback report
Brief Report
- Key insights
- Possible savings
- Generic Solutiıns
- 2x quick-wins
- Improvement roadmap
Standard
£16,000*1
Description
Balanced deep dive into two of our eight key operational areas with some tailored solutions.
Benchmark tool assessment*2
- Outputs
- Inputs
Interactive workshops
3x workshops
- Strategy
- Current State Review
- Future State Options
Area observations
- 1-day factory observations
Deep-dive evaluations
- 2x selected areas
Data analysis
- -
Feedback report
Summary Report
- Key insights
- Likely savings
- Aligned solutions
- 5x quick-wins
- Improvement roadmap- outline
Premium
£32,000*1
Description
Detailed, all-in scrutiny of all in-scope areas, delivering an explicit improvement roadmap and cost-saving validation.
Benchmark tool assessment*2
- Outputs
- Inputs
Interactive workshops
5x workshops
- Strategy
- Mobilisation
- Current State Review
- Future State Review
- Planning ahead
Area observations
- Critique of all in-scope areas
Deep-dive evaluations
- All in-scope areas *3
Data analysis
- Data exists*4
Feedback report
Detailed Report:
- Key insights
- Validated savings
- Bespoke solutions
- 10x quick-wins
- Improvement roadmap - explicit
*1 – Plus out-of-pocket expenses and applicable Value Added Tax
*2 – A structured benchmarking assessment tool comprised of 8 key operational areas
*3 – £4,500 for each optional extra in-scope focus area deep-dive included (3x core areas already included)
*4 – Data analysis is undertaken where feasible, based on available in-scope data and sampling
How Clarity Leads Into “Change”
- Where to start
- What to tackle first
- How to deliver big impact
- Who needs to be involved
- What the ideal outcome looks like
- How improvements support your wider organisational direction (subtle strategic tie-in)
Change : delivering real, visible improvements alongside your people.